Century 21 People’s Choice Realty Inc., Brokerage
120 MATHESON BLVD E #103
MISSISSAUGA, Ontario
L4K 0A4
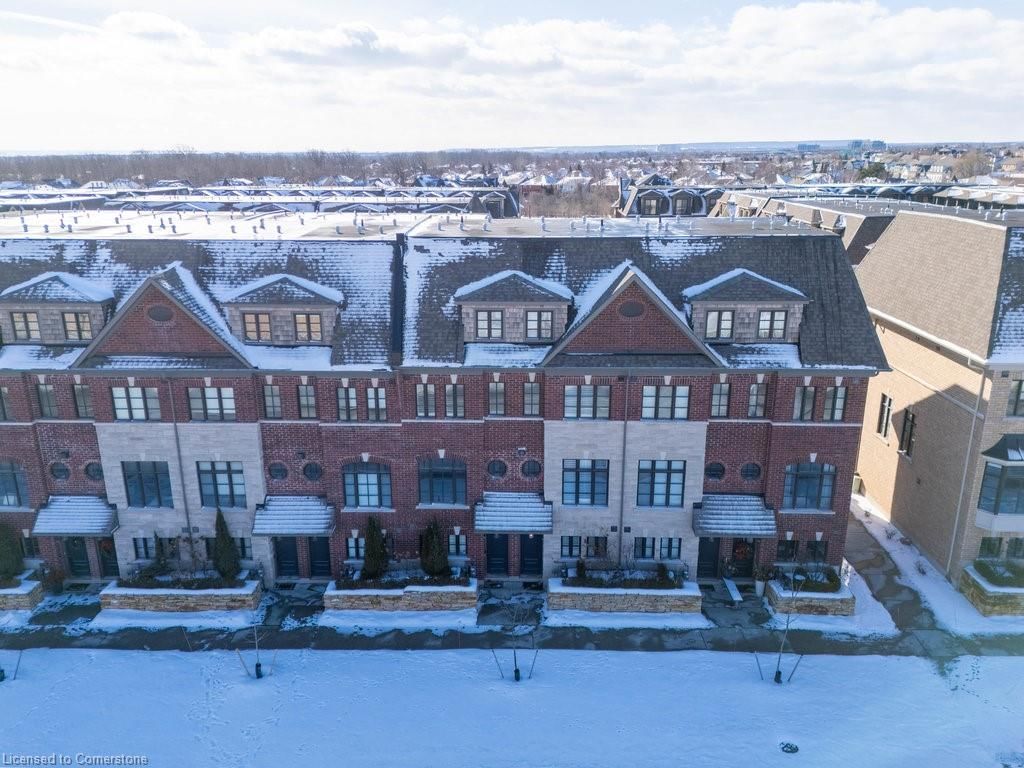


Oakville, RO River Oaks, L6H 7H2
$1,198,000
Listed by Royal LePage Real Estate Services Phinney Real Estate.
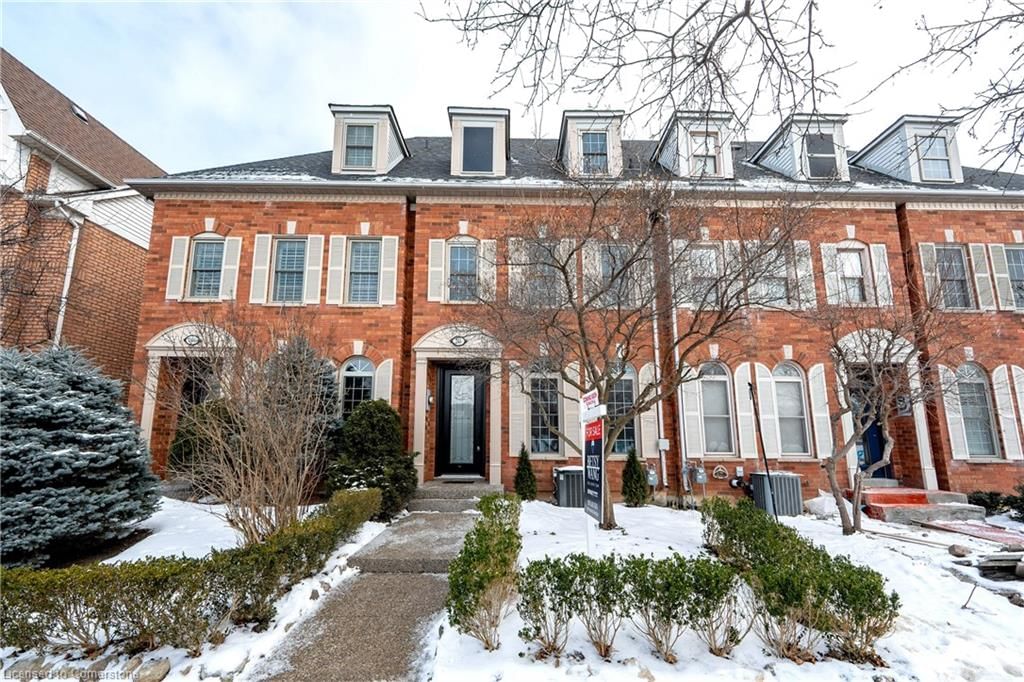
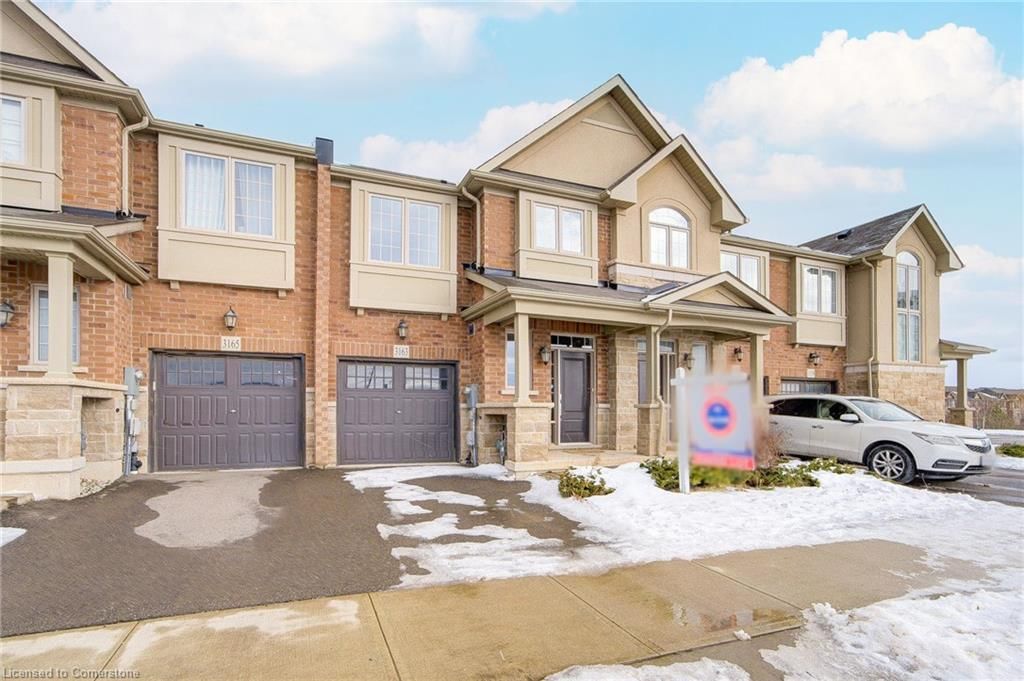
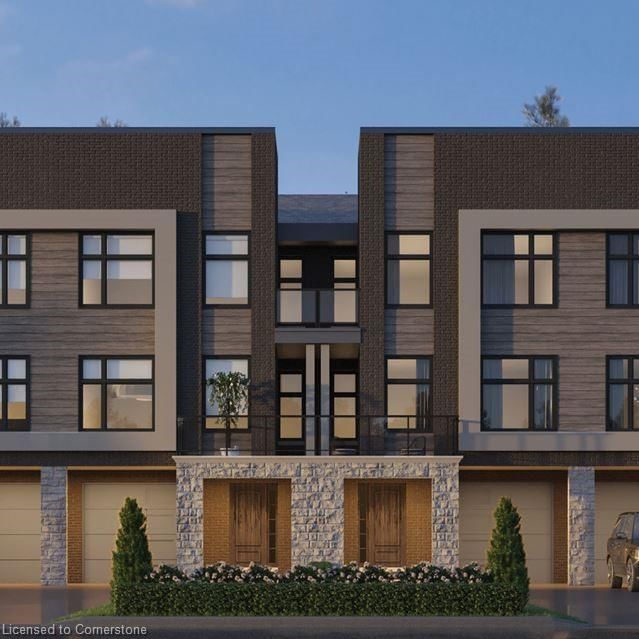
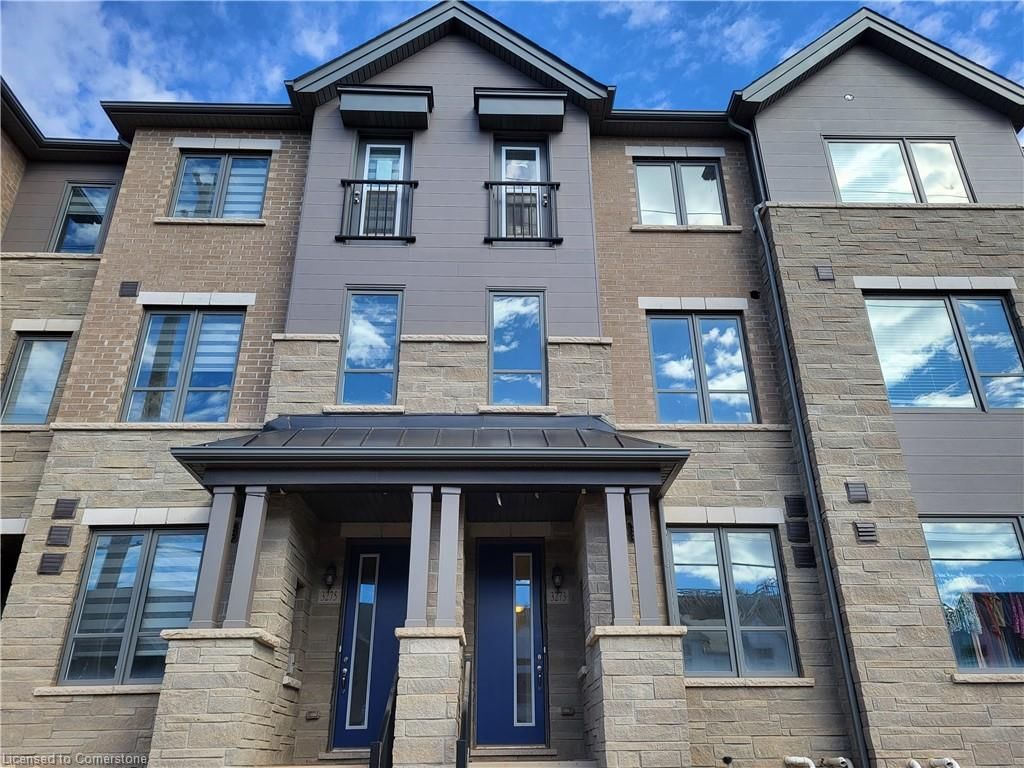
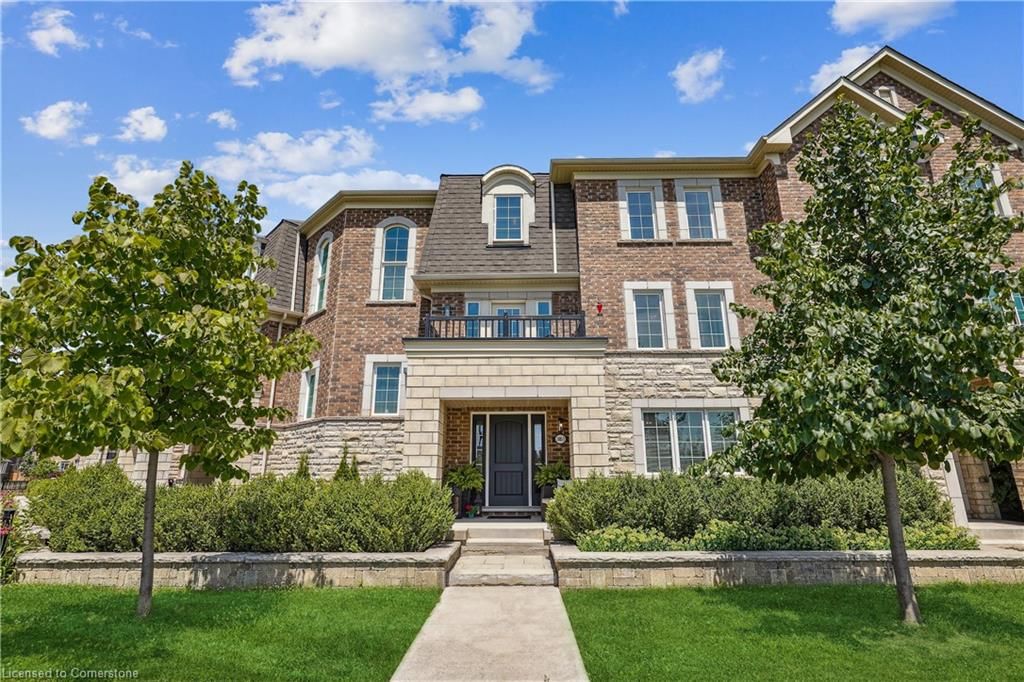
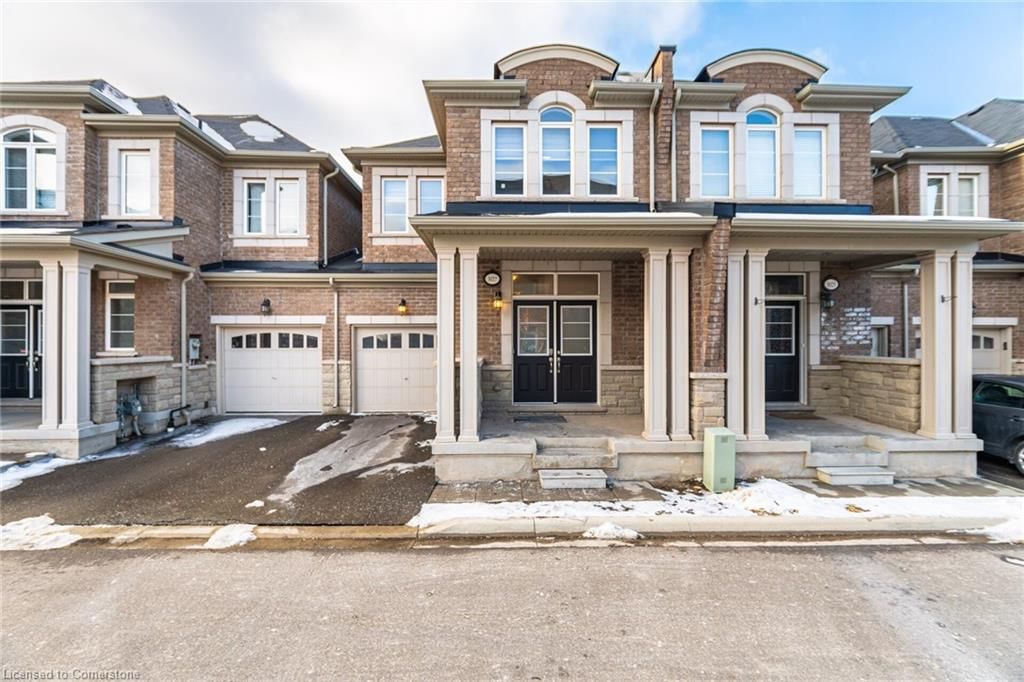
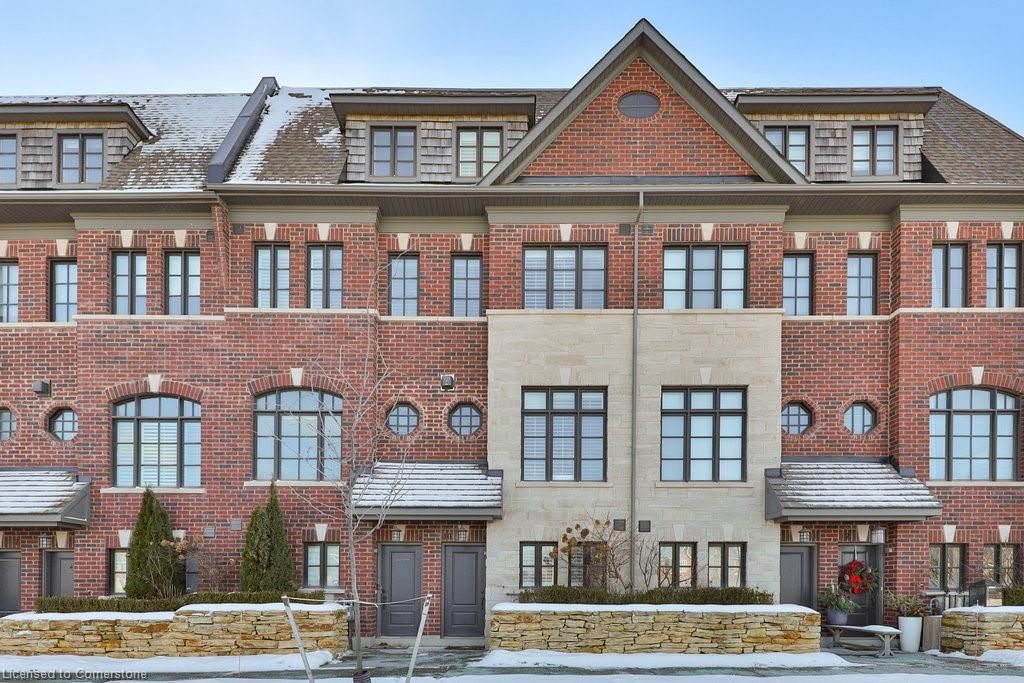
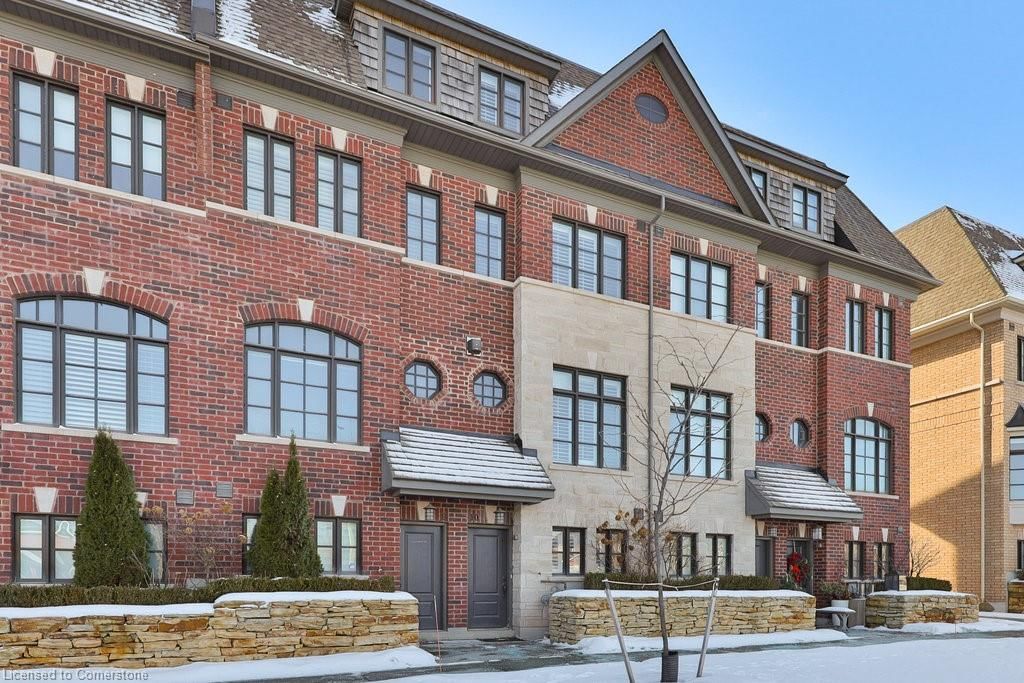
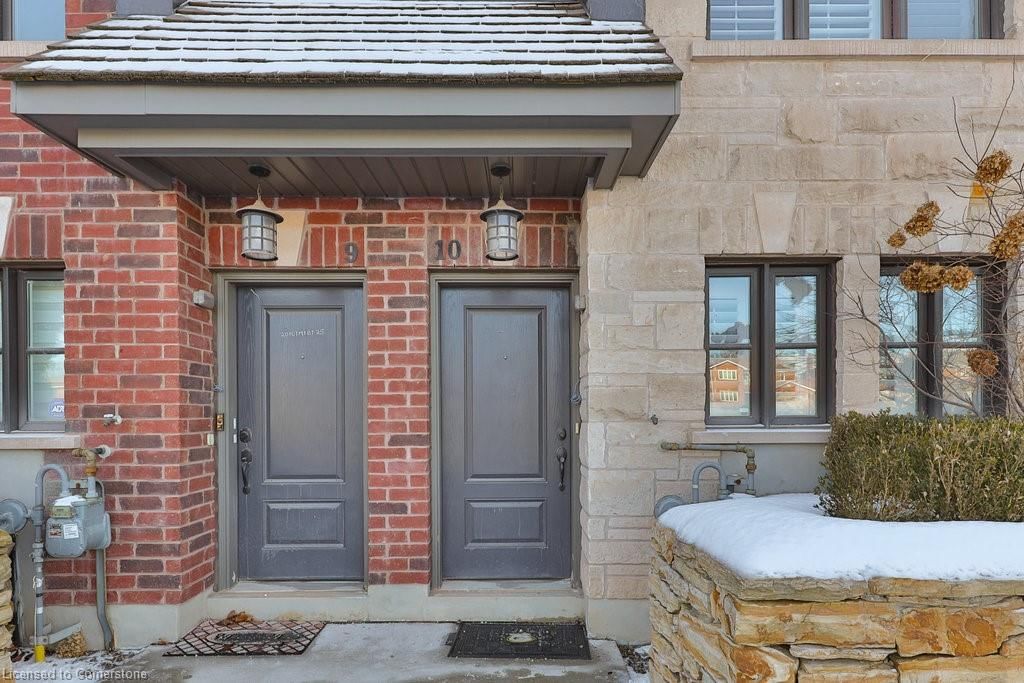
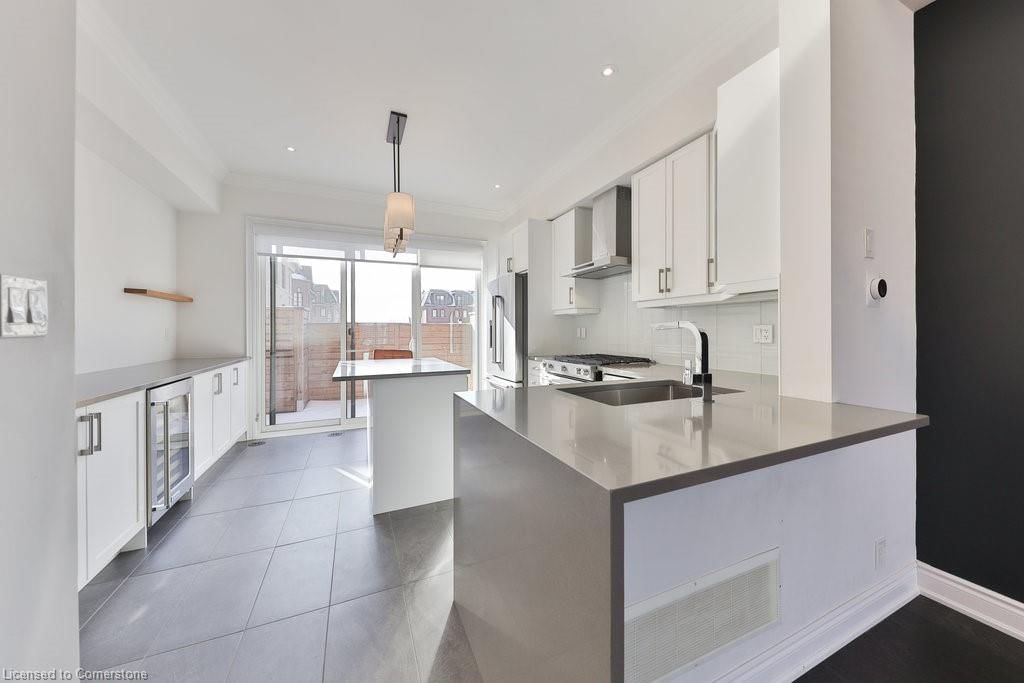
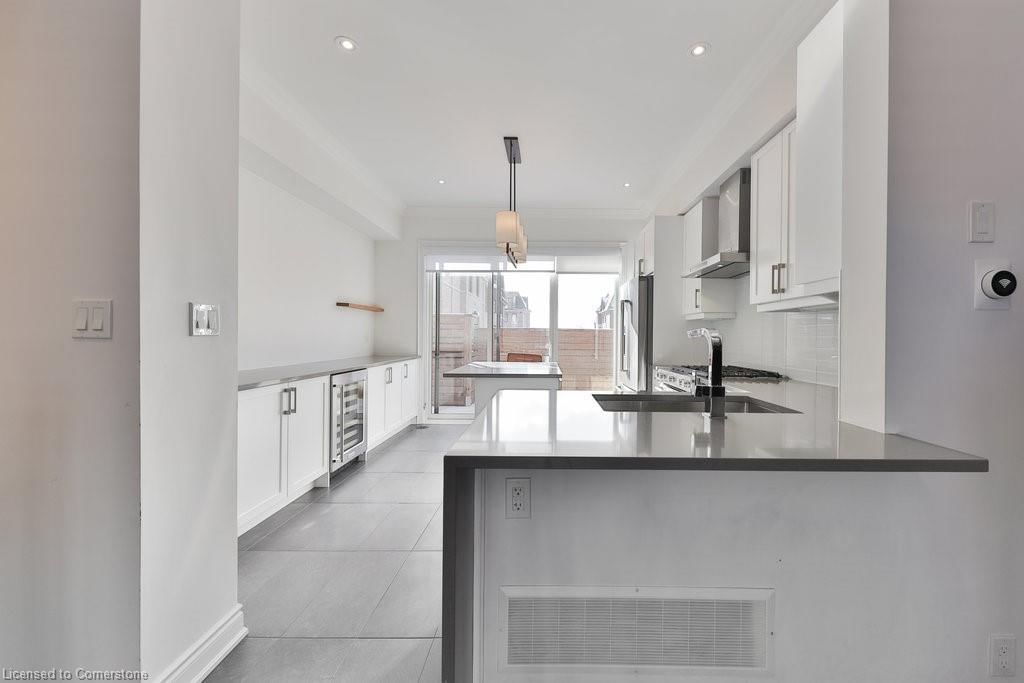
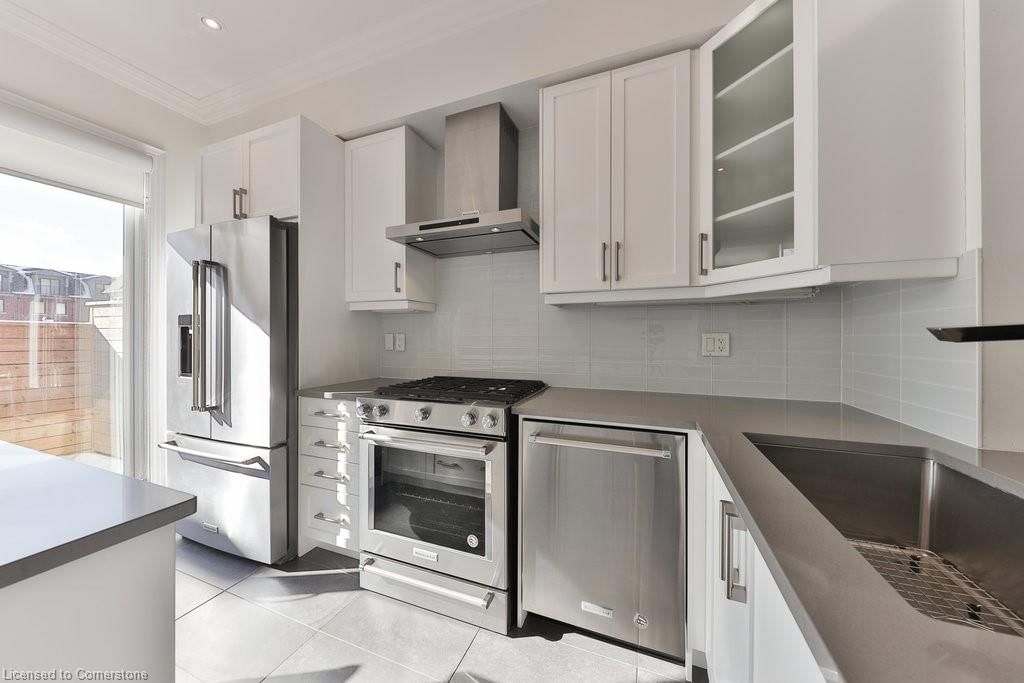
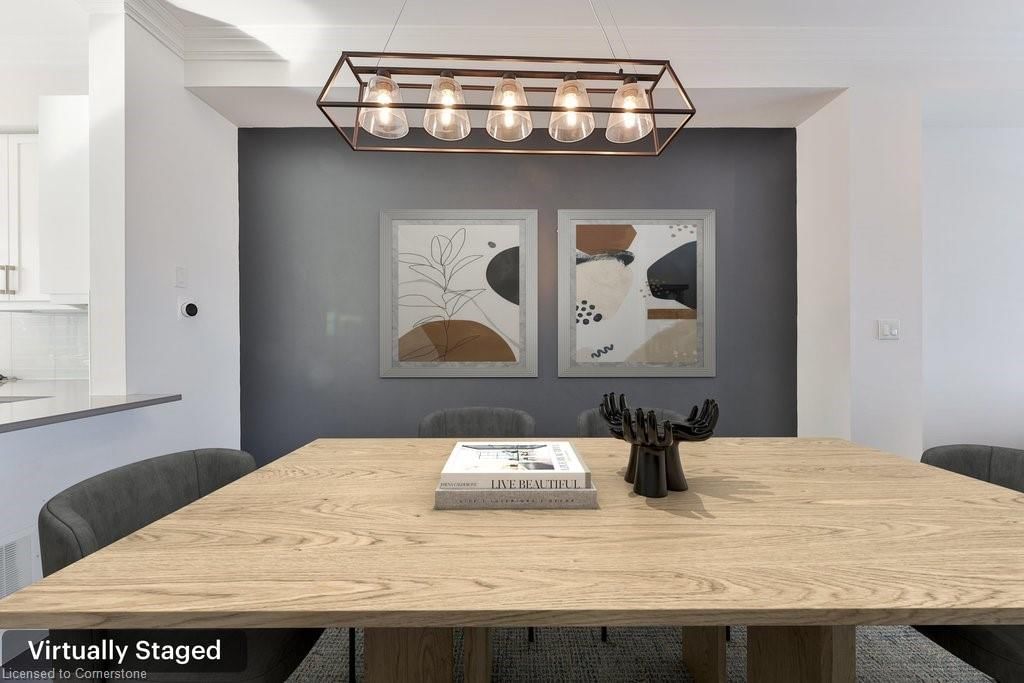
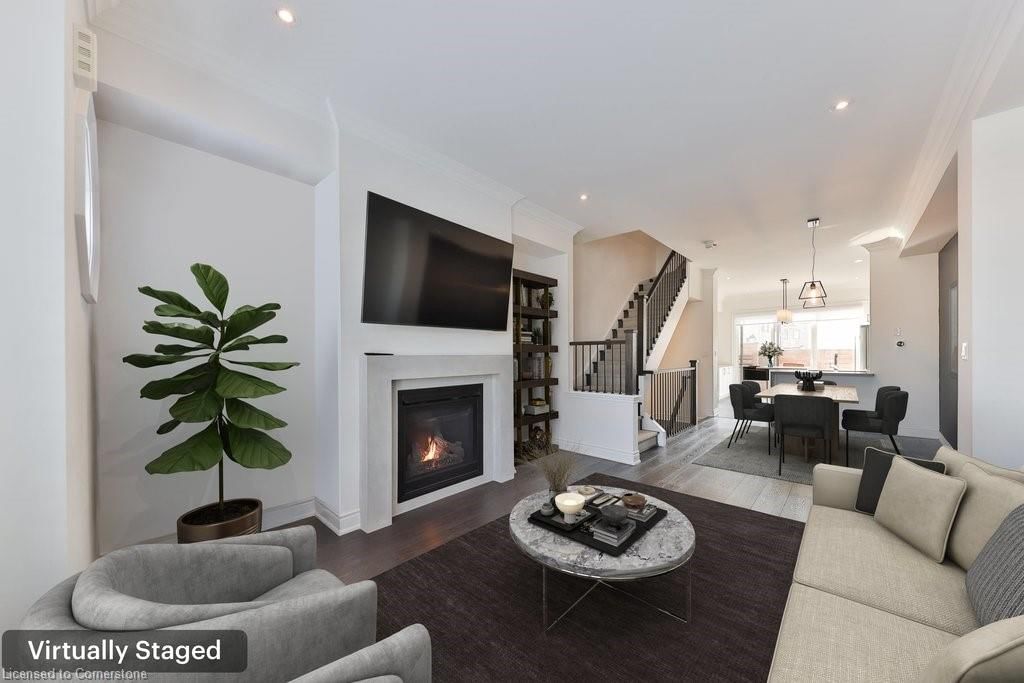
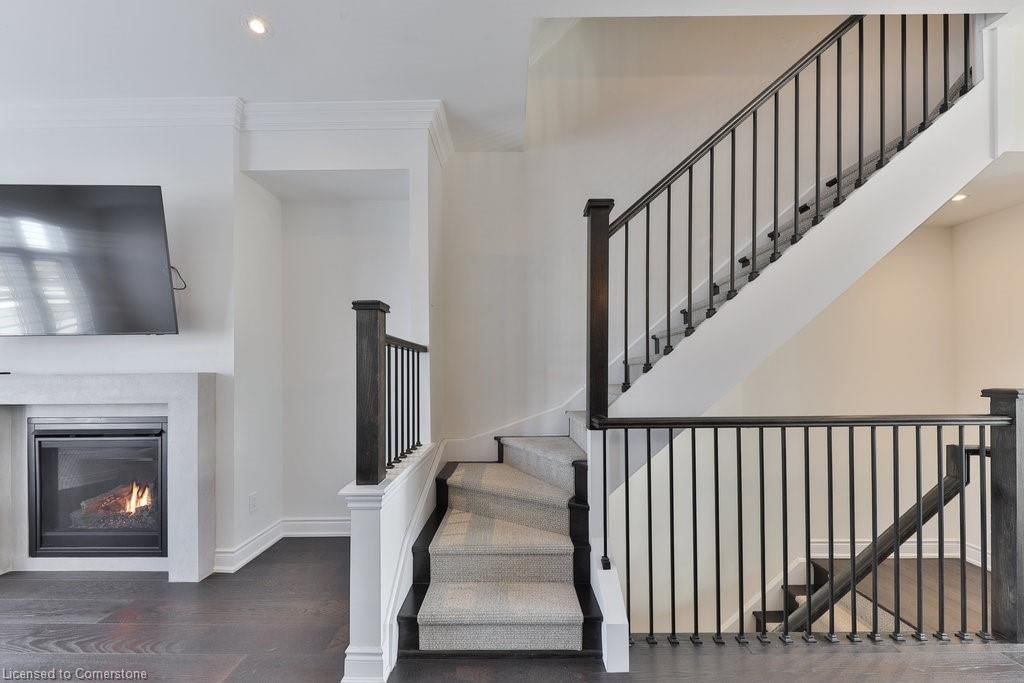
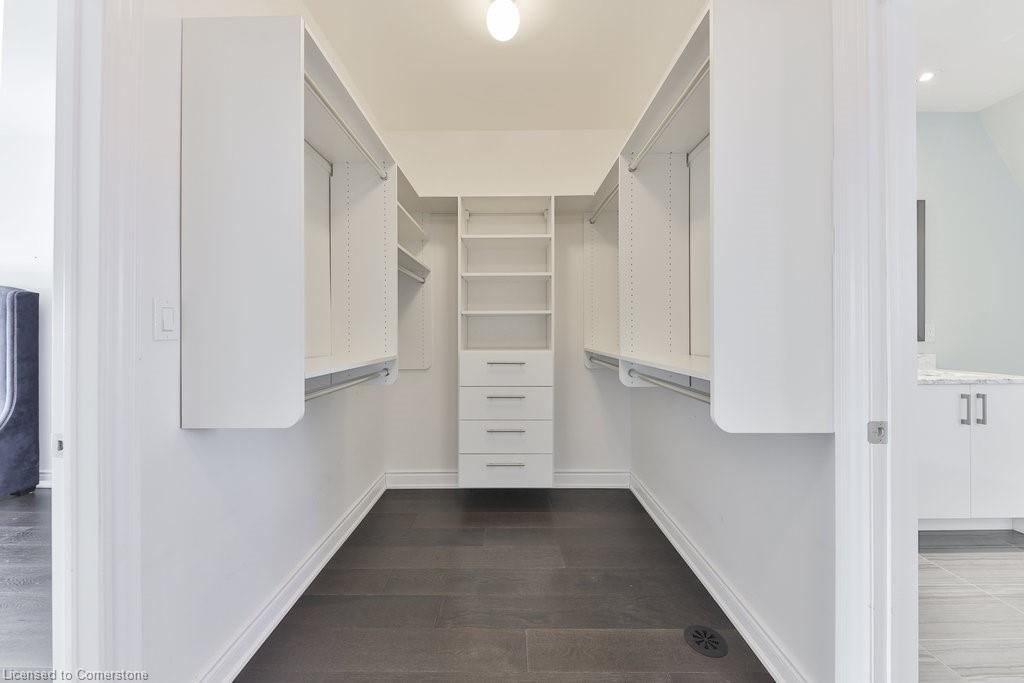
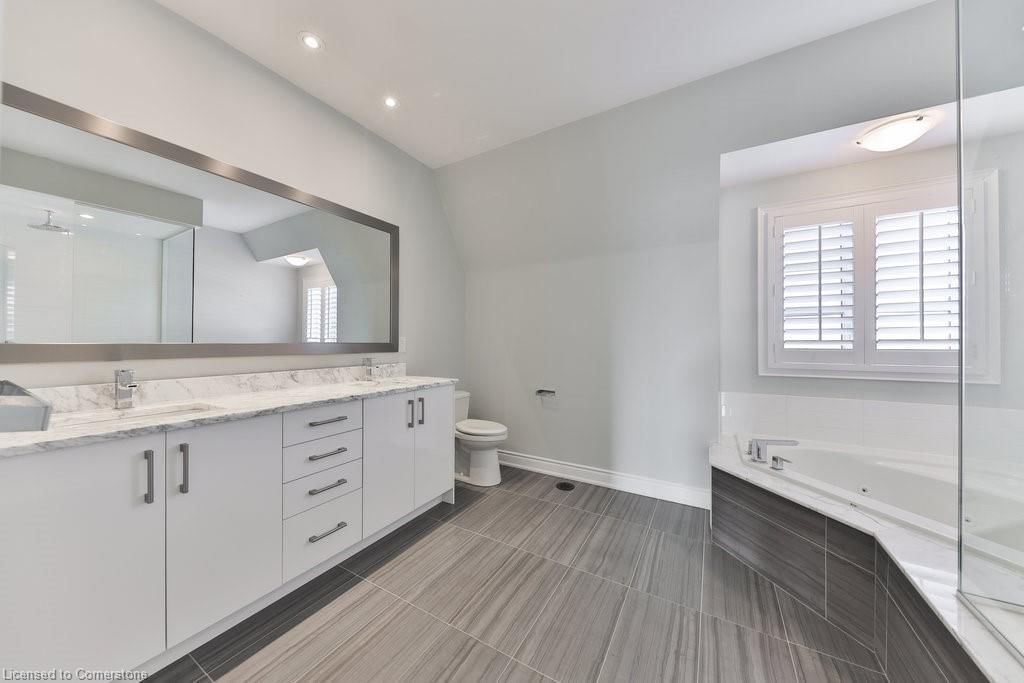
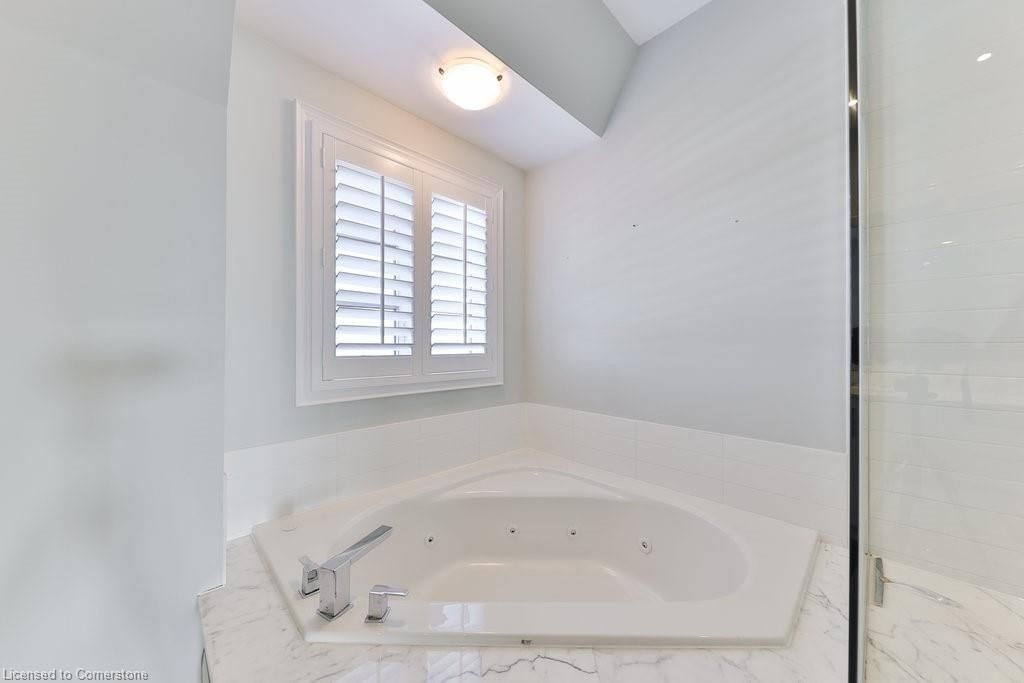
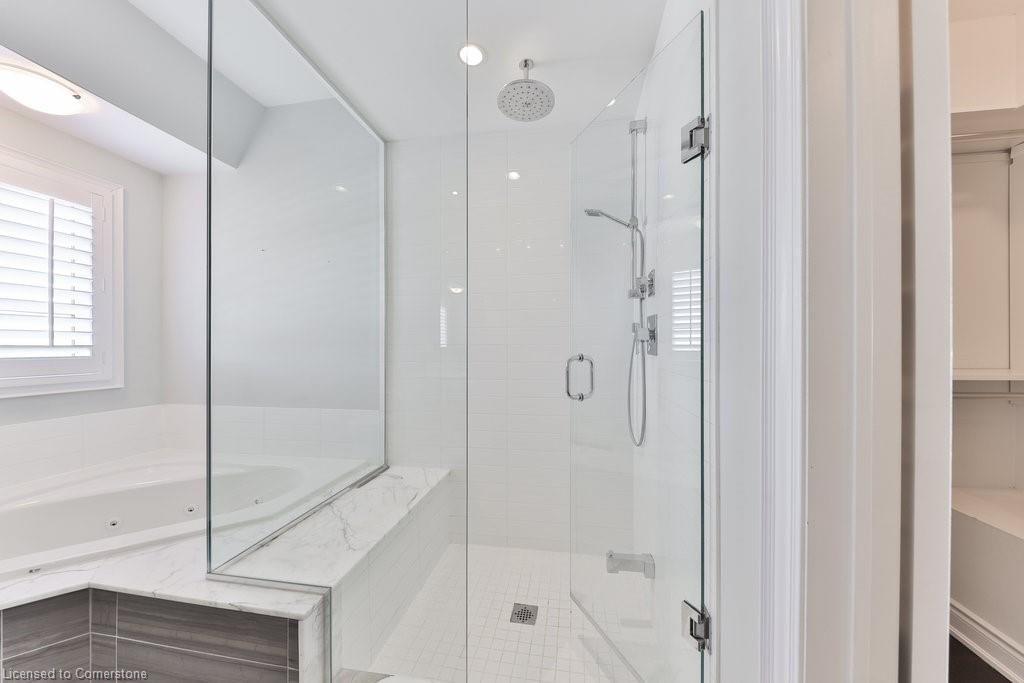
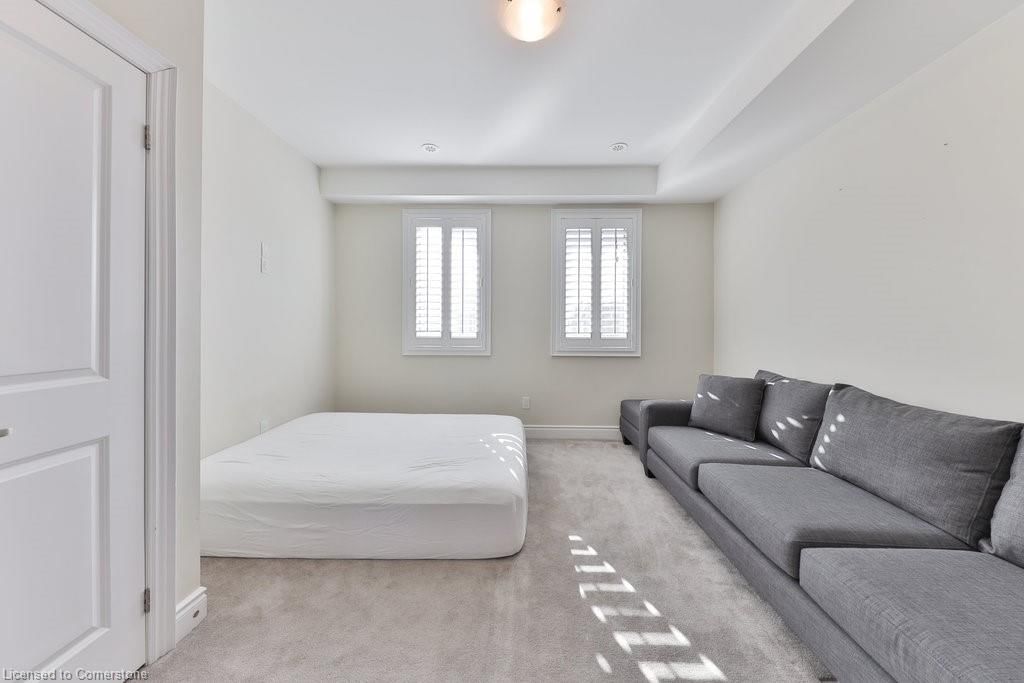
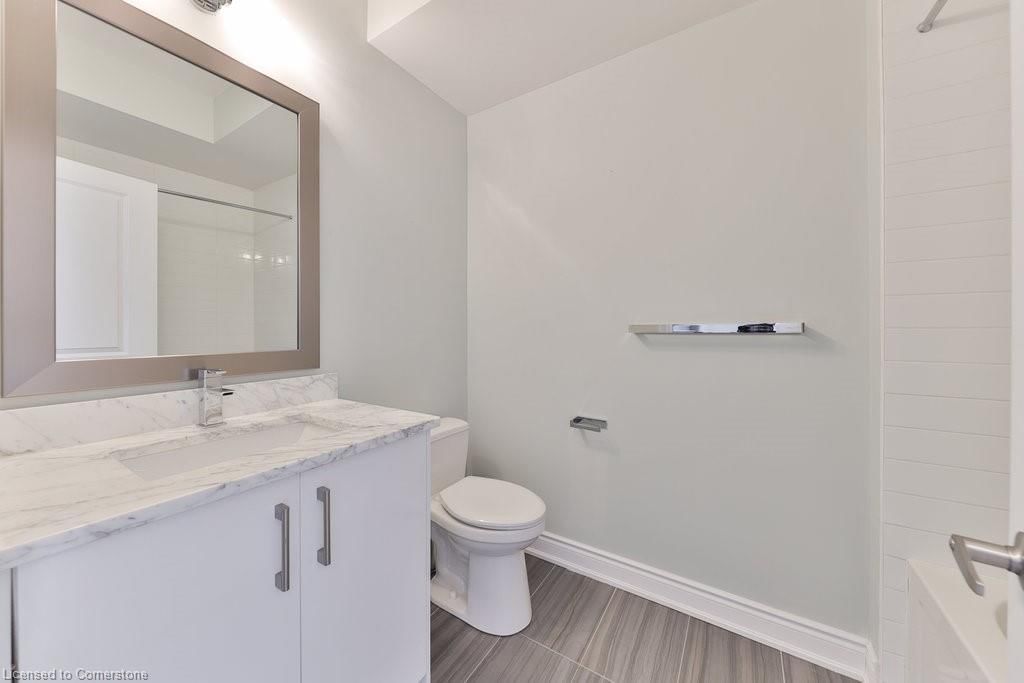
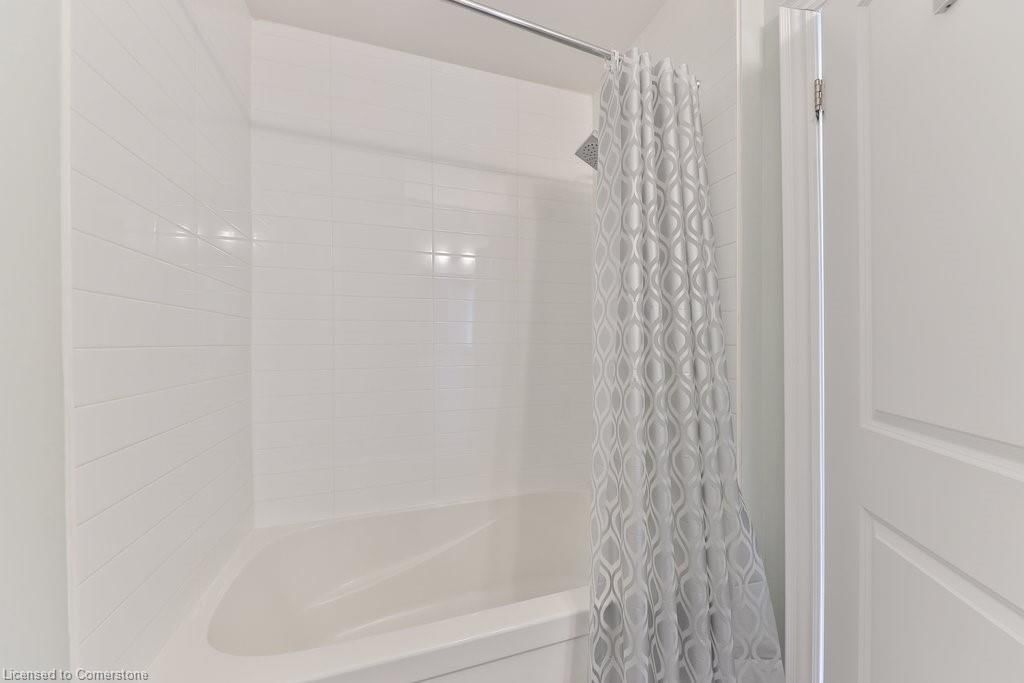
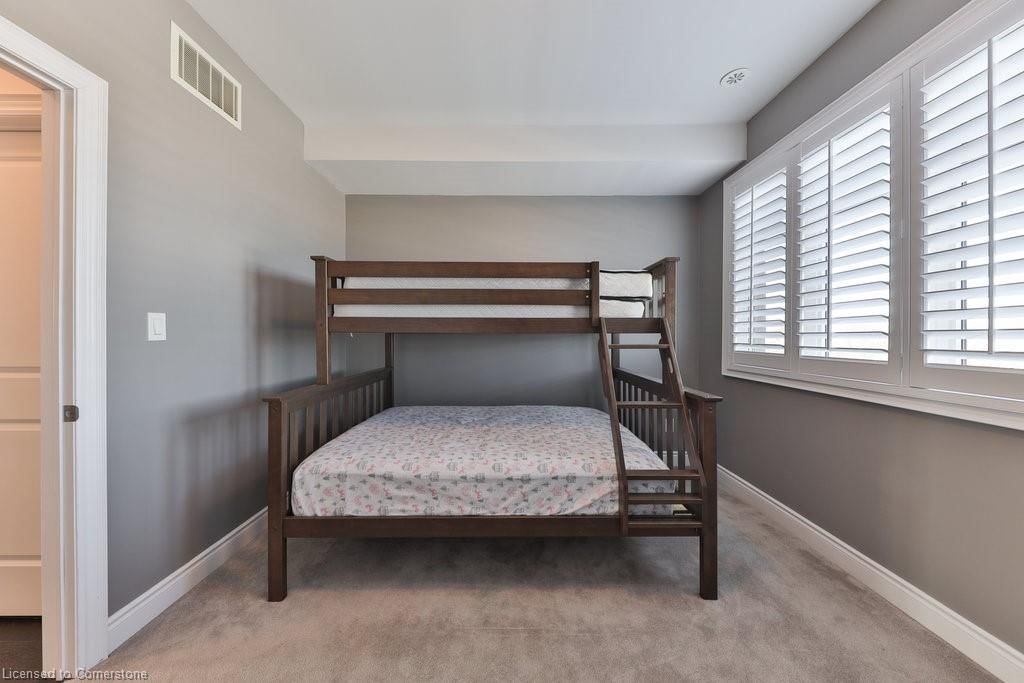
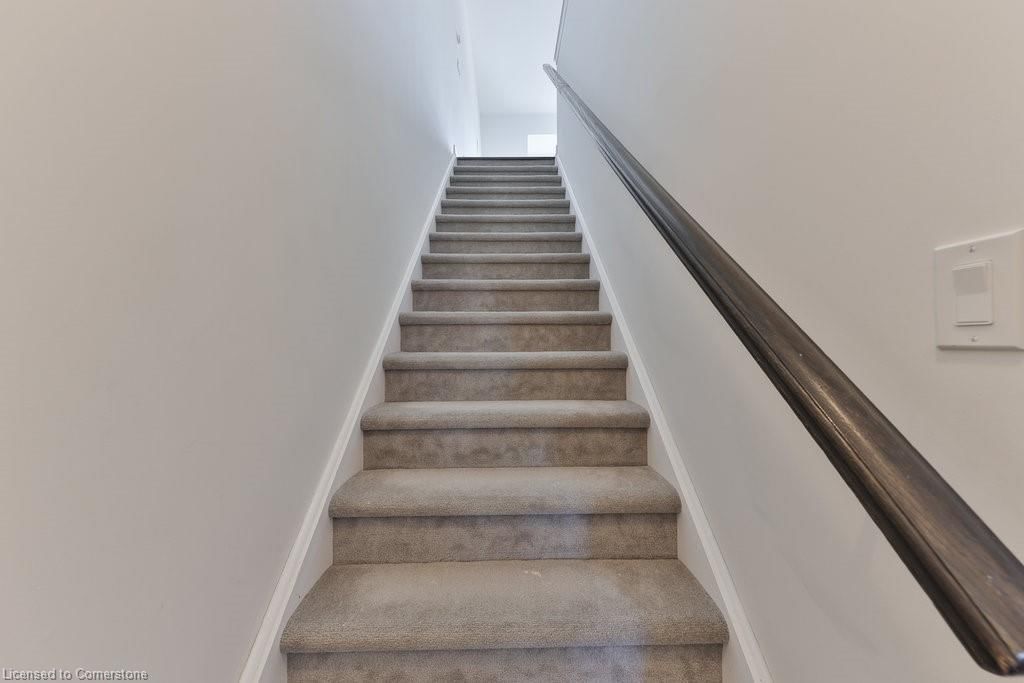
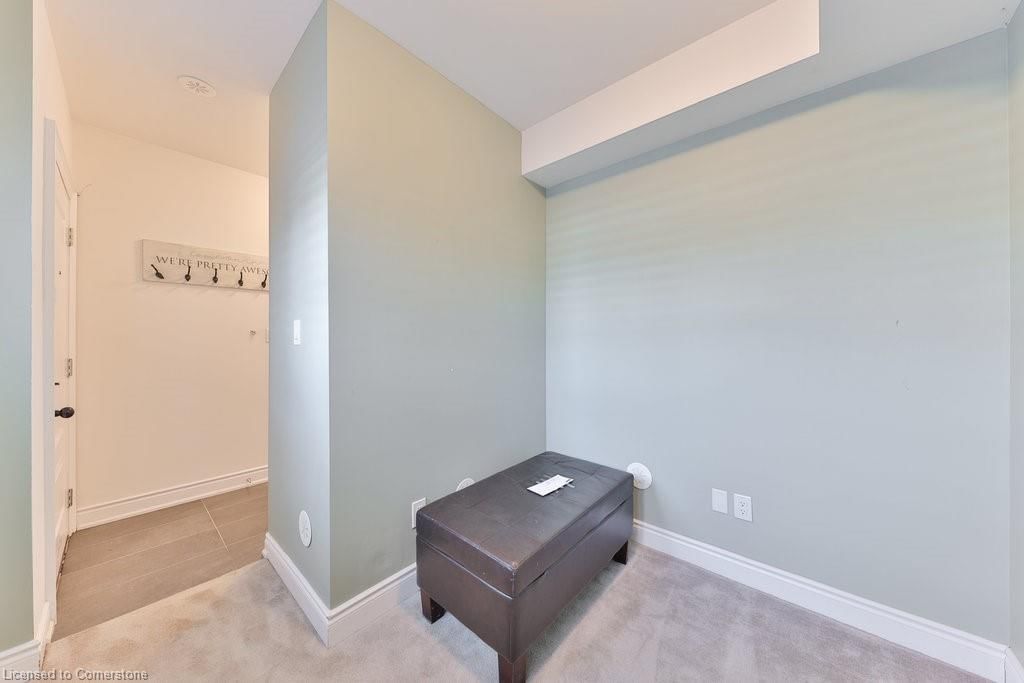
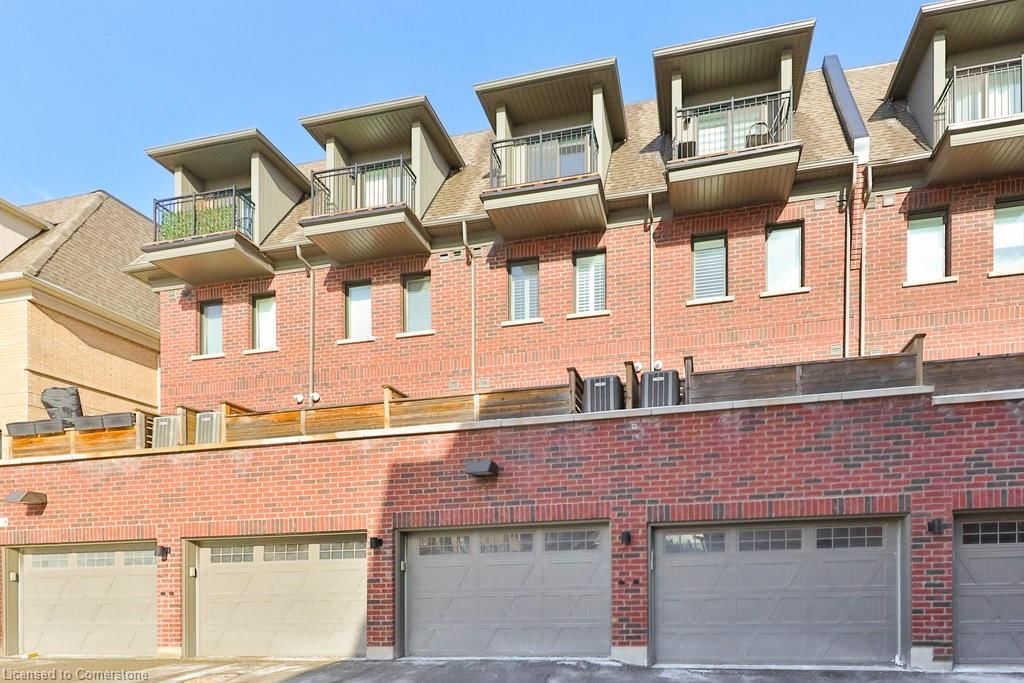
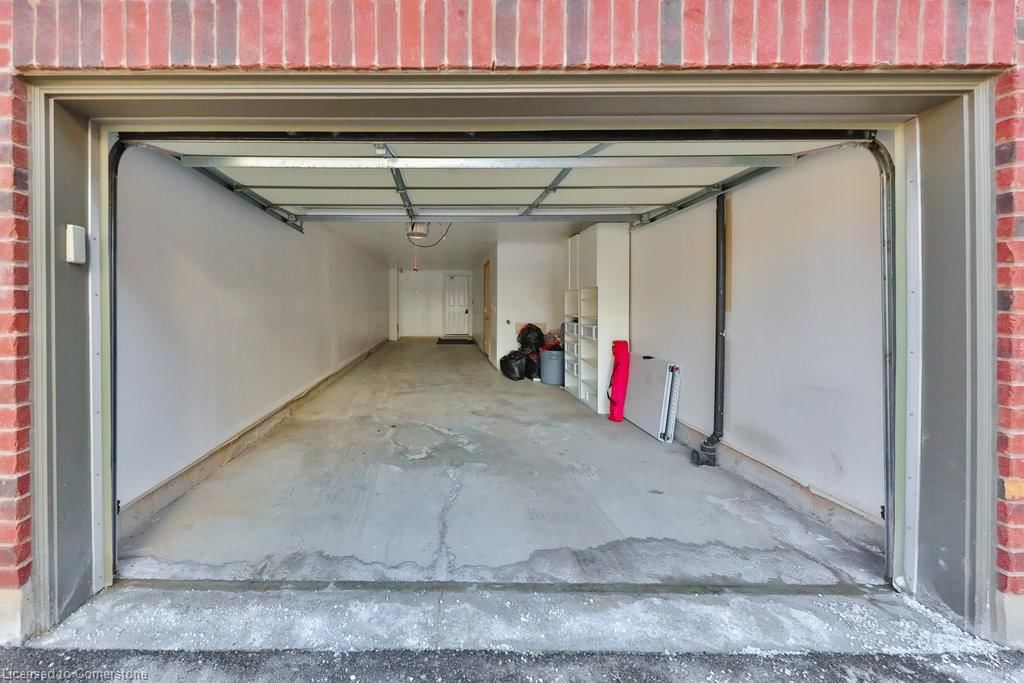
Welcome to this beautifully designed 3+1 bedroom , 3 bathroom townhome, where modern aesthetics meet comfort. The kitchen is a chef's dream, featuring sleek stainless steel appliances and a large window that floods the space with natural light, seamlessly opening to a separate dining area perfect for entertaining guests. The inviting living area boasts ample natural light and a gas fireplace, creating a warm and welcoming atmosphere. Retreat to the master suite, complete with a spacious walk-in closet and a luxurious five-piece ensuite bathroom. Additionally, the lower level offers versatile options, serving as an office, den, or an extra bedroom to suit your needs. This townhome is a perfect blend of style and functionality, making it an ideal place to call home. Close to Oakvilles downtown core, all amenities, major HWYS, transit and GO. *EASEMENT AS IN HR1338579 SUBJECT TO AN EASEMENT AS IN HR1427133 TOGETHER WITH AN EASEMENT OVER PART BLOCK 3 PLAN 20M1162 PARTS 24 & 25 20R20529 AS IN HR1441865 SUBJECT TO AN EASEMENT IN FAVOUR OF PART BLOCK 3 PLAN 20M1162 PARTS 27 TO 35 20R20529 AS IN
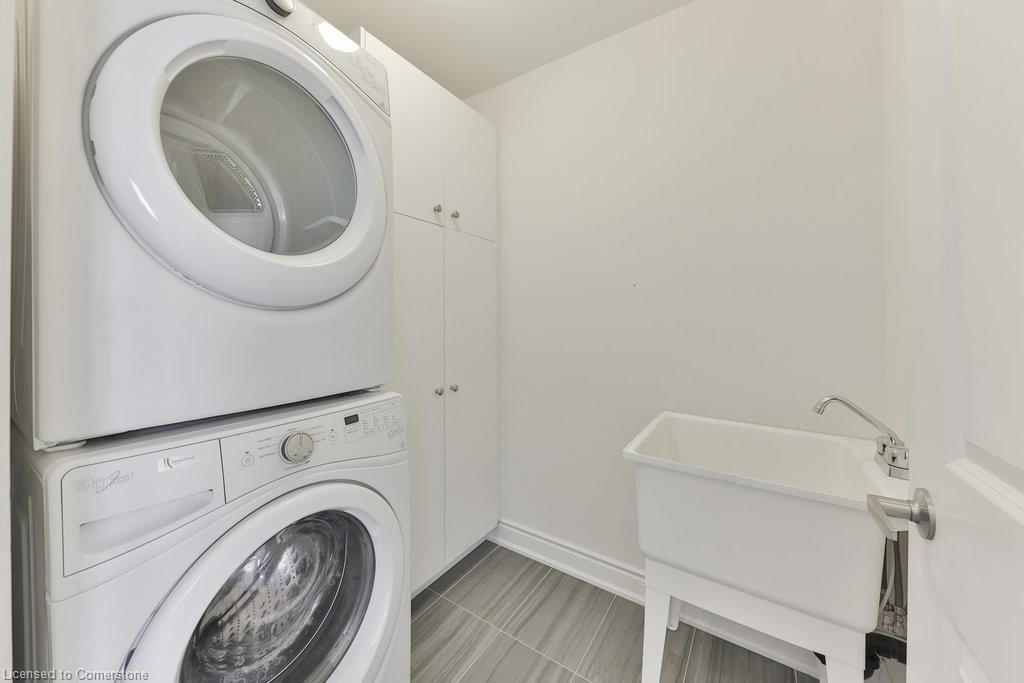
Built-in Microwave,Carbon Monoxide Detector,Dishwasher,Dryer,Garage Door Opener,Range Hood,Refrigerator,Smoke Detector,Stove,Washer,Window Coverings
Copyright 2025 Information Technology Systems Ontario, Inc. The information provided herein must only be used by consumers that have a bona fide interest in the purchase, sale, or lease of real estate and may not be used for any commercial purpose or any other purpose.
Living Room
Bedroom Primary
Dining Room
Bedroom
Bedroom
Kitchen
Bedroom
Bathroom
Laundry
Bathroom
Bathroom
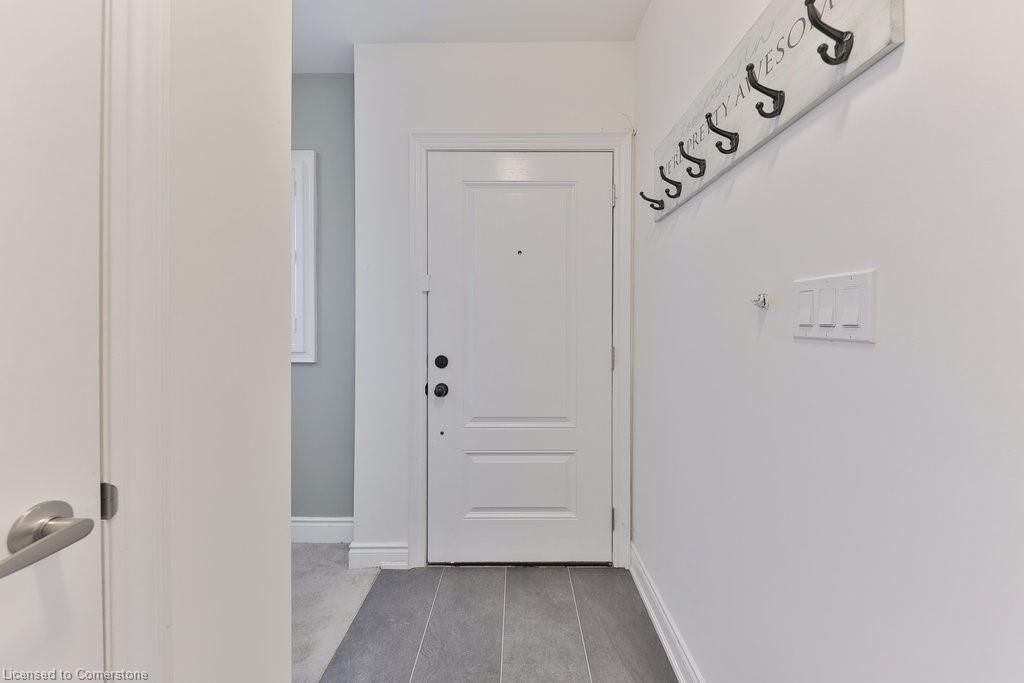
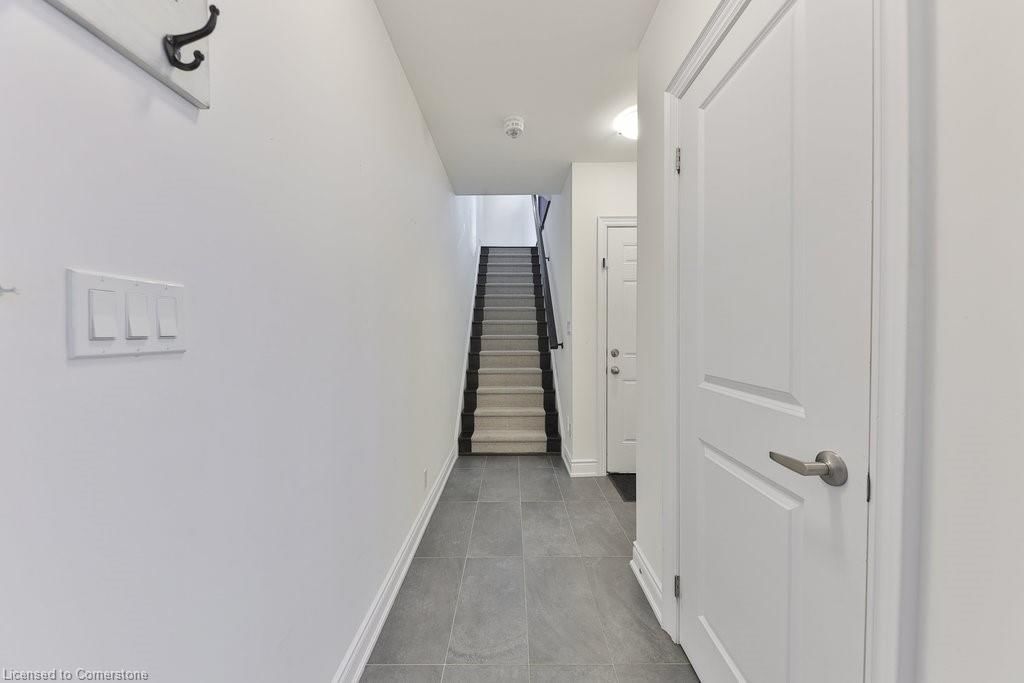
Foyer
The graph below compares the average list price and average sale price of homes in this neighborhood by month for the last 24 months. When average sale price is greater than average list price, this may suggest a buyer's market. When average sale price is lower than the average list price this may suggest a seller's market.
The graph below illustrates the average days on market for homes in this neighborhood. The yellow area may indicate a buyer's market, the green area may indicate a balanced market and the red area may indicate a seller's market.
Sales Representative, Century 21 People’s Choice Realty Inc., Brokerage
(647) 576 - 2100
Oakville, JM Joshua Meadows, L6H 7E3